
Why most fleet ROI claims don’t hold water
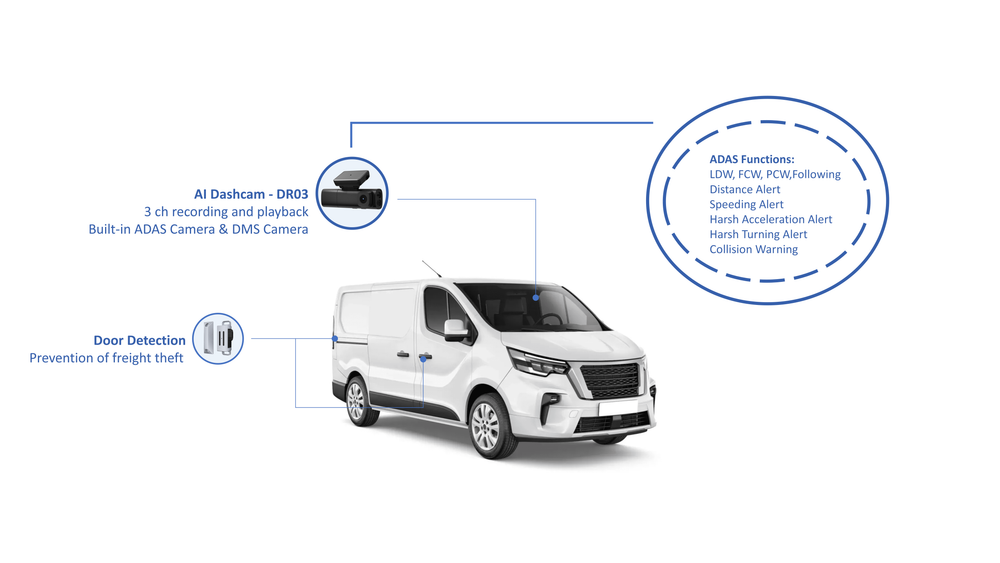
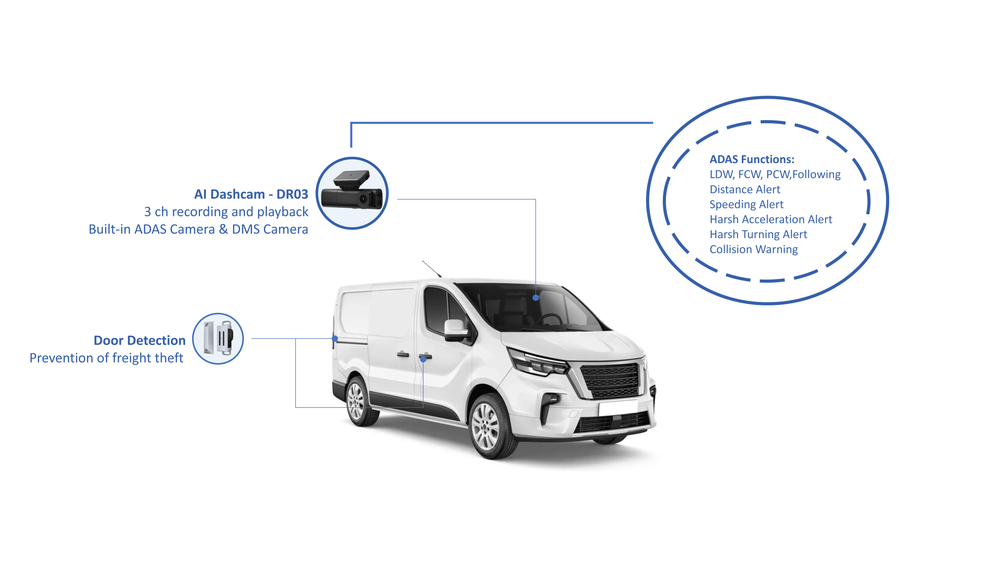
Folks talk a big game about savings, but what they usually miss is the hard math behind daily operations — maintenance surprises, idle hours, and routes that look good on paper but kill profit on the road. If you run service vans, you need clear van fleet management data to stop guessing and start measuring, and that usually means pairing process changes with a dependable van tracking system. I’ve worked with last-mile delivery fleets in Atlanta and seen the same blind spots: billing leaks, hidden downtime, and routing that eats margin. Fix those and the numbers start to sing.
Core problems that wreck ROI calculations
– Counting only fuel and ignoring labor and lost opportunity when vans sit idle. – Treating telematics as optional instead of a source of truth. – Using top-line savings (like lower fuel spend) as a stand-in for real operational value. – Failing to tie metrics to business outcomes (on-time rate, billable hours, customer retention).
Simple, problem-driven steps to evaluate true ROI
Start with what’s broken. Then measure what fixes it. Practical steps: – Inventory real costs: hourly labor, scheduled and unscheduled maintenance, fuel, insurance, and administrative time per job. – Track utilization: percent of time vans are doing billable work vs. parked. – Tie performance to dollars: translate on-time improvements, first-time-fix rate, and reduced idle minutes into revenue or avoided cost. – Run a 90-day pilot on a subset of vans. Compare before/after on the same routes and drivers. Don’t trust projections alone; trust short-term controlled results.
Metrics that actually predict value
– Billable hours per van per day. – On-time completion rate tied to customer charge or penalty. – Preventive maintenance compliance and the reduction in emergency repairs. – Route efficiency measured as usable stops per hour. These metrics tell you whether an investment is paying for itself or just creating nicer dashboards.
How tech should fit into the fix
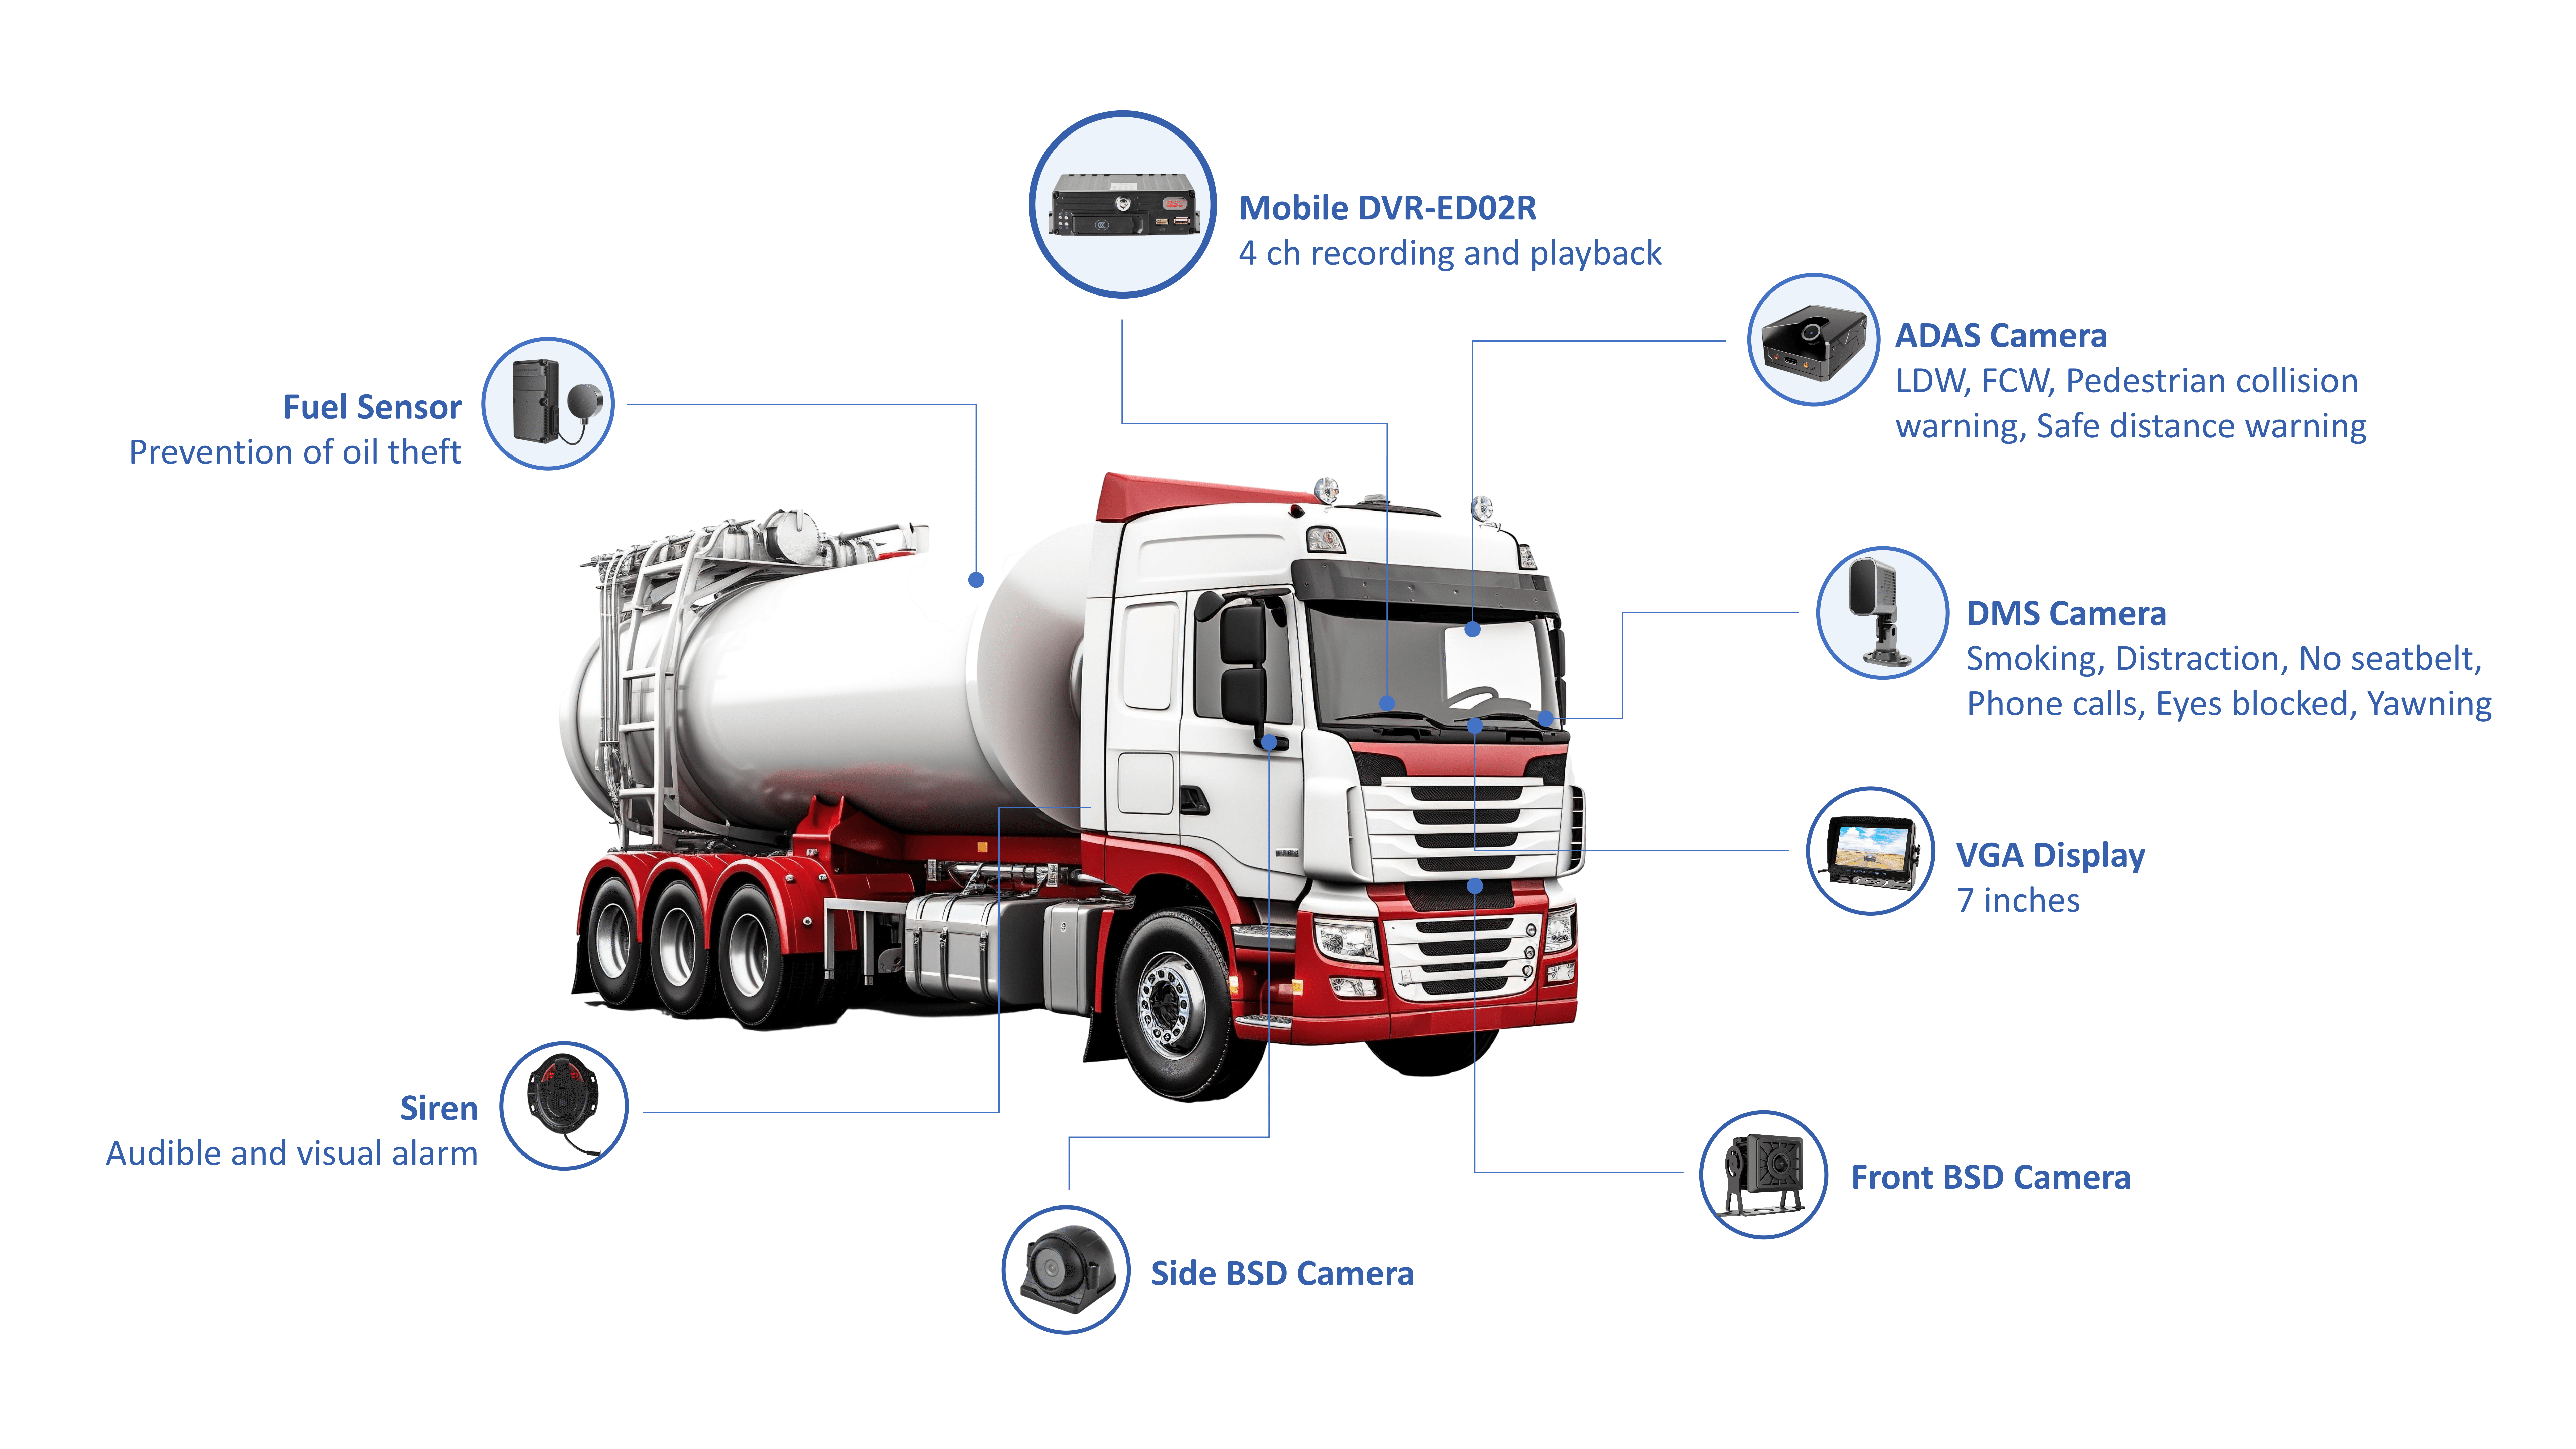
Technology is a tool, not the whole answer. A good van tracking system will give you timestamped location, idle time, and route playback. Use that output to change processes: adjust route windows, shift start times, or change maintenance intervals. When tech leads to a process tweak that saves time or money, you’ve got ROI you can explain to non-technical stakeholders.
Common mistakes when calculating payback
– Overstating savings by ignoring the cost of change (training, policy enforcement). – Using averages instead of looking at the worst-performing 20% of routes or vans. – Assuming vendor setup is zero-effort. Measure onboarding time and short-term productivity dips.
How to present findings so leaders act
Show two numbers: projected net benefit over 12 months, and the timeline to break even. Keep the story tight: here’s the problem, here’s the change, here’s the quick pilot data, here’s the extrapolated 12-month impact. Leaders respond to clear short-term wins backed by reproducible measurement.
Final thought — where the work meets value
Stop guessing and measure the parts that touch paychecks and customers. Fix the small, obvious problems first, validate with a short pilot, and use tracked, repeatable metrics to prove the case. That’s how you turn fleet talk into hard returns — the kind I’ve helped teams show on real runs — and why groups that adopt straightforward data and process changes often end up relying on BSJ solutions as a sensible part of their toolbox rather than a flashy add-on.